")
")
")
For getting help during the practical activities access: Instructions and Interpretations.
Aim and utility of this practical activity
- To create a research protocol for a study which aims at evaluating a diagnostic or screening method
- To analyze data and to present the results of the analysis
- To interpret the results from a statistical and a clinical point of view
Introduction
There are several means to establish a diagnosis, from clinical tests, preclinical tests to medical imaging. The purpose of assessing a diagnostic test is to determine the extent to which a new diagnostic method may be used in clinical practice and how exact that method is compared to the existing diagnostic methods. A better diagnostic method will aid to a more specific treatment of the determined pathology.
Since every new diagnostic test must be compared to a test already used in the clinical practice (a reference test), all patients included in a research must be tested with both tests. The clinically in use test is also known as the “standard test” or “the golden standard”.
The table below is a 2 by 2 contingency table representing the intersection between the results of the two tests, when both tests have just two results each. The table presents the absolute frequencies of the patients’ results (Table 1).
Table 1. Quality indicators based on the contingency table’s values
|
Ill (Standard test +) |
Healthy (Standard test -) |
Total |
||
|
New test+ |
TP (a) |
FP (b) |
TP+FP (a+b) |
→ PPV = TP/(TP+FP) |
|
New test - |
FN (c) |
TN (d) |
FN+TP (c+d) |
→ NPV = TN/(TN+FN) |
|
Total |
TP+FN (a+c) |
FP+TN (b+d) |
n (a+b+c+d) |
|
|
↓ Se=TP/(TP+FN) |
↓ Sp=TN/(TN+FP) |
Ac=(TP+TN)/n |
where:
TP (True Positive)= number of ill patients having a positive new test - marked with a
FP (False Positive)= number of healthy patients having a positive new test - marked with b
FN (False Negative)= number of ill patients having a negative new test - marked with c
TN (True Negative)= number of healthy patients having a negative new test - marked with d.
Statistical indicators – formulas and definitions
The indicators to assess the qualities of a new diagnostic method/test are computed based on the values from the contingency table. Each indicator has an associated 95% confidence interval, which estimates the value of the parameter in the target population with a probability of 0.95.
- Se (Sensitivity) = a / (a+c)
Sensitivity is the proportion of subjects with a positive new test out of all the ill subjects. Sensitivity represents the probability of an ill subject to have a positive new test.
- Sp (Specificity) = d / (b+d)
Specificity is the proportion of subjects with a negative new test out of all the healthy subjects. Specificity represents the probability of a healthy subject to have a negative new test.
- PPV (Positive Predictive Value) = a / (a+b)
Positive Predictive Value is the proportion of ill subjects out of all the subjects with a positive new test. PPV represents the probability of a subject with a positive new test to be ill.
- NPV (Negative Predictive Value) = d / (c+d)
Negative Predictive Value is the proportion of healthy subjects out of all the subjects with a negative new test. NPV represents the probability of a subject with a negative new test to be healthy.
- Ac (Accuracy) = (a+d) / n
Accuracy is used to show the capacity of a test to identify the subjects correctly (ill subjects and healthy subjects as well) out of all the subjects. The higher is the accuracy, the better is the test.
- LR+ (Positive Likelihood Ratio) = Se / (1-Sp)
LR+ shows how many times a positive result in the new test is more likely to occur in ill subjects than in healthy subjects.
- LR- (Negative Likelihood Ratio) = (1-Se) / Sp
LR- shows how many times a negative result in the new test is more likely to occur in ill subjects than in healthy subjects.
To compute the above indicators and their 95% confidence intervals you may use this link: http://statpages.org/ctab2x2.html
Other indicators of use in the medical practice are:
- Pre-test probability = the probability of a subject to be ill before using the new diagnostic test to determine the presence of the disease. It can also be the disease’s prevalence or a particular probability as a result from the medical history and clinical examination of a subject.
- Post-test probability (using Fagan’s nomogram) = the probability of a subject to be ill when testing positive to the new test (use the LR+ value) or the probability of a subject to be healthy when testing negative to the new test (use the LR- value).
To use the Fagan’s nomogram for computing the post-test probability, we need to know pre-test probability, the new test’s result for our subject and the value for LR positive/negative (according to the test result). Mark on the first line a dot for the pre-test probability value and a dot on the second line for the likelihood ratio value. Next, draw a line by uniting the dots and see where this line crosses over the post-test line.
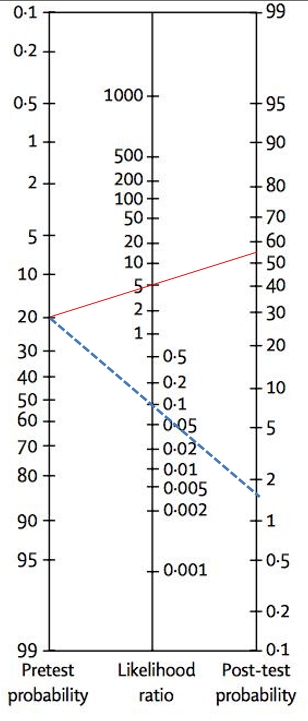
Fig. 1 Fagan’s nomogram used for a pathology having a 20% prevalence, with LR+ = 5 and LR- = 0,1. If the subject has a positive new test, his chance to be ill is of 55% (see the red line on the graph). If the subject has a negative new test, his chance to be ill is of 1,8% (see the doted blue line on the graph).
There are online apps you can use to compute, for any subject, values like in the Figure 1 example (http://araw.mede.uic.edu/cgi-bin/testcalc.pl, use the third table). For the above app, for ”'prevalence” use the disease prevalence or the pre-test probability, for LR+, LR- use the computed values, for “Total sample size” use the number of subjects in your sample (if the sample size is unknown, then the confidence interval cannot be computed).
- Clinical interpretation:
Se, SP, PPV, NPV:
A diagnostic indicator like Se or Sp, which is close to 100%, means that the new test has a high diagnostic quality. There are some cases when high values as close to 100% as possible are needed, for example the HIV test that checks for the presence of the virus.
|
Indicator value |
>90% |
A high diagnostic quality |
|
80-90% |
A moderate diagnostic quality |
|
|
80% |
A low diagnostic quality |
|
|
Close to 50% (but > 50%) |
A diagnostic quality almost absent |
According to the needs, the appropriate test is chosen for screening or for precision diagnostic. The choice of a diagnostic test for precision diagnostic of pathology is based on the test having the highest Sp value. Choosing a diagnostic test to do the screening for pathology is based on the test with the highest Se value. In practice, besides the test’s precision, we must take into account other parameters (costs, patient’s preferences, etc.).
Likelihood ratio:
Some LR values may lead to more or less significant changes in the post-test probability of a patient’s diagnosis. The table below acts as coarse guide to LR interpretation:
|
LR+ value |
LR- value |
Interpretation |
|
>10 |
less than 0,1 |
leads to significant and often conclusive changes in the pre-test probability. |
|
between 5 and 10 |
between 0,1 and 0,2 |
leads to moderate and useful changes of the pre-test probability. |
|
between 2 and 5 |
between 0,2 and 0,5 |
leads to little but sometimes important changes of the pre-test probability. |
|
between 1 and 2 |
between 0,5 and 1 |
leads to very modest and rarely important changes of the pre-test probability. |
Example of a study evaluating diagnostic methods:
The use of ultrasound in the diagnosis of acute appendicitis in children
Binkovitz LA et al. published a study in Pediatric Radiology, where they evaluated the ultrasound accuracy for determining the diagnosis of acute appendicitis in children: Binkovitz LA, Unsdorfer KM, Thapa P, Kolbe AB, Hull NC, Zingula SN, et al. Pediatric appendiceal ultrasound: accuracy, determinacy and clinical outcomes. Pediatr Radiol. 2015;45(13):1934-44.
Article source: https://link.springer.com/article/10.1007%2Fs00247-015-3432-7#Sec1
Definitions of terms used in this article :
- Appendicitis is the inflammation of the appendix. It is one of the most frequent causes of abdominal pain in children and it requires a surgical intervention. Clinically, appendicitis manifestation includes pain situated in the right lower quadrant (RLQ), as well as nausea, vomiting, fever, anorexia.
- Appendectomy = the surgical removal of the appendix.
- Ultrasound (US) = is a medical imaging method that uses ultrasounds to check abdominal organs. US do not irradiate the body, it takes little time and has high accuracy in the appendicitis diagnosis, and this depends on the examiner’s experience, of course.
- Histopathology = is considered the surest method to diagnose appendicitis, as it examines microscopically the inflamed tissue from the surgically removed appendix.
The scenario of the example study:
The study by Binkovitz et al. investigated children registered at Mayo Clinic Rochester (USA) between January 2010 and June 2014. The aim was to assess the impact of patient and system factors on the accuracy of pediatric appendiceal US and to investigate how indeterminate results impact patient outcomes.
Inclusion criteria: In the study were included children less than 18 years old, who presented acute abdominal symptoms and had abdominal US reports that contained the words “appendix” or “appendicitis”.
Exclusion criteria: Were excluded those who previously had an appendectomy or a CT scan for acute appendicitis prior to the US, if the US was performed at an outside institution, and if the child did not undergo an appendectomy and had no clinical follow-up after discharge.
The US test results were compared to those of a histopathology performed on a tissue sample from the surgical removal of the appendix. The study examined a group of 572 patient records with clear ultrasound diagnosis (the patient with / without appendicitis).
There was a second group of 218 patients, whose ultrasound diagnosis was uncertain/ indeterminate.
Study protocol
1. Aim and objectives of the study
The aim was to assess the impact of patient and system factors on the accuracy of pediatric appendiceal US and to investigate how indeterminate results impact patient outcomes.
Objectives:
(1) Evaluating the impact of patient factors (gender, age, BMI, symptom duration) or system factors (the hour of medical examination, examination year) on US accuracy;
(2) Evaluating the influence of indeterminate US results on CT scans and on the rate of negative surgical results;
(3) Presenting strategies to decrease the rate of indeterminate US results and to increase their accuracy.
2. Domain of research: Evaluation of a diagnostic test
3. Study type:
- A. Based on study objectives: Analytical
- B. Based on the researcher’s role: Observational
4. Accessible population and study sample
The pathology to diagnose: Acute appendicitis
Accessible population:
Children 18 years old, who presented acute abdominal symptoms.
Study sample:
Inclusion criteria:
Children 18 years old registered at Mayo Clinic Rochester (USA) between January 2010 and June 2014, who presented acute abdominal symptoms and had an abdominal US report that contained the words “appendix” or “appendicitis”..
Exclusion criteria:
Were excluded those who previously had an appendectomy or a CT scan for acute appendicitis prior to the US, if the US was performed at an outside institution, and if the child did not undergo an appendectomy and had no clinical follow-up after discharge.
Sample size:
790 US reports:
group 1 – 572 patient reports gave a definitive diagnosis
group 2 – 218 patient reports had indeterminate results.
5. Data collection method
- A. Based on the studied population: sampling
- B. Based on the duration of data collection: longitudinal retrospective (data is collected from reports)
- C. Based on the grouping method: representative sample ( research is performed on a sample group closely mirroring all characteristics of the target population from which it has been extracted).
The evaluated diagnostic method/test: Ultrasound (US)
The standard test: Histopathology examination
- It is not mentioned who performed the standard test, we can only assume it could have been a pathologist.
Did the doctor who performed the US or the standard test know the results of the other test?
- It is not mentioned, we could only assume that it was impossible for the doctor who performed the US to know the histopathology result since the US was performed before the surgery (also, the patients who had a US after the appendectomy were excluded from the study). We do not know if the pathologist knew the US results.
6. Statistical analysis
Demographic and clinical characteristics of children:
Qualitative variables: gender, pain being present in RLQ, time of US performance (on-call or off-call), US result, histopathology result.
Quantitative variables: age, height, weight, BMI, symptom duration at the time of US.
Qualitative variables were described by using percentages, while quantitative variables were described by using the mean and the standard deviation.
T- test (Student test) was used for quantitative variables, the Chi2 test and Fisher exact test were used for qualitative variables. Statistical significance was set at P 0.05.
Evaluation of diagnostic performance:
- Sensitivity, Specificity
- Positive Predictive Value, Negative Predictive Value
- Prevalence, Accuracy, LR+, LR-
Expected results. Data analysis and presentation
- Sample description
Based on the inclusion and exclusion criteria there were 790 reports, where 452 belonged to girls (57%) and 338 to boys (43%).
The mean age was 10,4±4,5 years, the mean BMI was 19,8±4,8.
The majority of examinations were performed during on-call hours (581, or 73%), just 209 (27%) were performed off-call hours.
There were 146 cases of acute appendicitis, with a prevalence of 18.5%.
Two groups were analyzed:
- Group 1 – children having a definitive diagnosis (with / without appendicitis)
- Group 2 – children having indeterminate results
- The association between US results and those from histopathology examinations for group 1
Table 1. Contingency table for US results and those from histopathology examinations for group 1
|
HP+ |
HP- |
Total |
|
|
US+ |
109 |
17 |
126 |
|
US- |
6 |
440 |
446 |
|
Total |
115 |
457 |
572 |
US+ = had a positive result for appendicitis in the US examination; US- = had a negative result for appendicitis in the US examination; HP+ = with appendicitis proven histopathologically; HP - = without appendicitis.
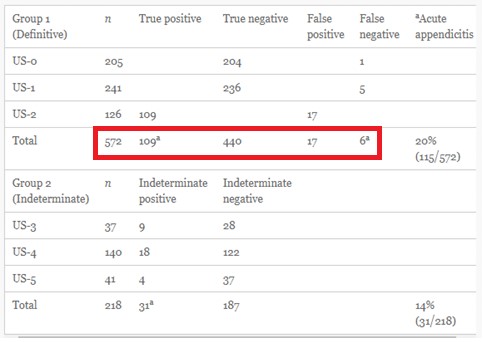
Group 1 had 109 patients with positive results in both US and histopathology, 440 patients with negative results to both tests, 17 patients had a positive US and a negative histopathology, 6 patients had a negative US and a positive histopathology ( table 2 in the article).
Table 2. Distribution of US scores and the standard test diagnosis
- Computation of indicators for group 1:
- Prevalence = 115/572=0,20 – 20%
- Se = 109/115 = 0,94 – 94%
- Sp = 440/457 = 0,96 – 96%
- PPV = 109/126 = 0,86 – 86%
- NPV = 440/446 = 0,98 – 98%
- LR+ = 0,94/(1-0,96) = 25,47
- LR- = (1-0,94)/0,96 = 0,05
- Accuracy= (109+440)/572=0,96 – 96%
Data interpretation. Discussions
- Interpreting the results from statistical point of view
Se =0,94 => 94% patients. There is a 94% chance that a patient with appendicitis had a positive US.
Sp =0,96 => 96% patients. There is a 0.96 probability that a patient without appendicitis had a negative US.
PPV = 0,86. There is a 0,86 probability that a patient with a positive US to have appendicitis.
NPV = 0,98. There is a 98% chance that a patient with a negative US to be without appendicitis.
- Interpreting the results from a clinical point of view
- Both Se and Sp were >90%, thus US had a high diagnostic quality..
- Is the US examination a useful method for screening of appendicitis in children?
- Se has a high value, so US could be used for screening. Regardless how high this value is, screening appendicitis is useless since this is a disease which cannot be prevented by a screening method, because it is treated only when the symptoms occur.
- Is the US examination a useful method for precision diagnostic of appendicitis among children?
- Since Sp presented a large value, there is a high clinical diagnostic quality and the test can be used for precision diagnostic.
- What is the probability of a child to have appendicitis if suspected of appendicitis and the US result was positive?
- For a prevalence of approximately ~20% and LR+ of 25,4, where the total number of patients is 572, then the post-test probability is 0,86 (~86%).
- What is the probability of a child with acute abdominal symptoms and a negative US result to have appendicitis?
- A prevalence of ~20% and LR- of 0,05 , for a total number of 572 patients, the probability is approximately 0,01 (~1%).
Study conclusions
US accuracy was high, without being influenced by factors regarding patients or factors related to the system/ doctors.
The experienced doctors may diagnose or exclude appendicitis in almost 70% of the children, with an accuracy of 96%.
A certain US diagnosis may decrease the rate of CT usage and the rate on negative surgical interventions.
On Infomed server, on your personal disk space make a new folder called LAB04. Download the following file in this folder and fill in all practical activity’s requirements. Save the file.