")
")
")
For getting help during the practical activities access: Instructions and Interpretations.
Please complete this anonymous questionnaire, to help us improve our teaching.
Thank you !
Introductory information:
Survival data consists of the time elapsed between the starting point of patient observation and the occurrence of the expected event, or the patient’s age when the event takes place (for example: the time span starting from the diagnostic of ovarian cancer until the death of the patient, the time elapsed between the starting of chemotherapy for the Hodgkin lymphoma until the relapse).
Survival data analysis means implementing a series of statistical methods specific for survival data. Since survival data present some particular traits, they require a different statistical analysis than that designed for quantitative data. Thus, there are incomplete data (for example: incomplete data for the subjects who do not reach the established event (for example healing/ death)). Incomplete data is called censored data. Also, the distribution of survival data is not normal. The censorship and abnormality of the distribution of survival data requires appropriate statistical methods for their correct analysis.
Survival data are graphically described by survival curves. The most commonly used method of representation is the Kaplan Meier method. The survival curve shows how the proportion of living patients (or did not achieve the predefined event (death / healing, ...) varies over time. This starts with 100% of survivors at the start of the study, and this number decreases as time passes.
To describe the "average" survival of subjects in a group, the median survival time is used (since data is not normally distributed). In order to assess whether there is a difference between the survival of a group and another group, the log-rank test is used (most commonly, in some situations other tests are used). To predict the survival time according to different characteristics of the subjects (e.g. tumor stage, histological type, ...) the Cox regression is used (most frequently, but there are other methods as well). The Cox regression is also used to find out if a characteristic of the subjects influences survival, and if so, how much, and in what direction (prolongs or shortens it). Thus, the Cox regression is useful for assessing the existence and importance of the link between prognostic factors and survival.
The hazard ratio (HR) is used to assess the importance of the effect of a characteristic on survival. The hazard ratio is calculated based on the hazard.
The hazard is the instantaneous risk of a subject of developing the pre-established event, given that he/she survived to that point (e.g., the instant risk of dying of a subject with malignant melanoma). The higher the hazard, the greater the risk of dying (or making another pre-established event). For example, the person who drives a car after drinking alcohol has a higher risk than a person who drives the car but did not consumed alcohol). The hazard ratio of one group of subjects compared to another group of subjects represents the ratio of the hazards of the two groups of subjects (the risk ratio of subjects with lung adenocarcinoma compared to subjects with epidermoid lung cancer).
In this practical activity you will describe the survival data, test the difference between different subject groups in terms of survival, and evaluate the importance of the effect of some survival characteristics.
Example scenario
Study protocol
To answer these questions, we will read different sections (specified for each question) of the article entitled “Effect of mitoxantrone on outcome of children with first relapse of acute lymphoblastic leukemia (ALL R3): an open-label randomized trial”, the authors being Parker C, Waters R, Leighton C, et al. published in the Lancet. 2010 Dec 11; 376 (9757): 2009-2017. http://www.ncbi.nlm.nih.gov/pmc/articles/PMC3010035/
- Aim and Objectives (Abstract & the last paragraph of Introduction)
Purpose: To evaluate the effect of mitoxantrone versus idarubicin in children with acute lymphoblastic leukemia whose disease has recurred under current treatment regimens.
Objectives of the study:
- comparing the global survival between mitoxantrone and idarubicin in children with acute lymphoblastic leukemia whose disease has recurred under current treatments.
- comparing the progression-free survival between mitoxantrone and idarubicin in children with acute lymphoblastic leukemia whose disease has recurred under current treatments.
- Field of research: Evaluation of a therapeutic approach
- Type of the study: (Methods)
- Depending on the objectives of the study:
o Analytical (tests, comparisons, links, associations);
- Depending on the results / the intervention of the researcher on the subjects and evolution of the studied disease):
o Experimental (the researcher intervenes by administering pharmaceutical preparations to influence the evolution of the disease);
- Depending on the design:
o Using parallel groups (each subject is assigned to a single group throughout the study: mitoxantrone vs. idarubicin);
- Depending on the objective of the trial:
o Therapeutical effectiveness / pragmatic trial (trial conducted in conditions similar to those in the current life, including possible problems of patient compliance);
- Depending on the clinical hypothesis:
o Trial of superiority (the hypothesis of the trial is that mitoxantrone is superior to idarubicin);
- Depending on the drug development phase:
o Phase IV trial (Pharmacovigilance / post-marketing phase - after launching (marketing) both medicines.)
Depending on the methods used to ensure the validity of the study by avoiding systematic errors (bias) and confounding factors:
- Randomized trial: in this case the subjects were randomly assigned (random / randomized) to the two comparisons. "Open-label randomized trial"
- The "allocation concealed" trial – in this case the person who introduced the subjects did not know what the patient would receive - Randomization and masking –“which enabled the concealment allocation”;
- Intent to treat trial: in this case all patients were analyzed in the groups in which they were randomized ("intention to treat analysis" - whether they received mitoxantrone or idarubicin, even if they did not take all the treatment, or if they discontinued it, the patients were analyzed as if they had taken the treatment correctly);
- Open label trial: The blind / masked method was not used - both the patient and the investigator knew what was "open-label randomized trial";
- The trial was controlled (the assessed treatment was compared to idarubicin).
- Accessible Population and Study Sample (Methods)
Target population
- Clinical characteristics (e.g., disease, disease status, complications, functional condition): Patients on the first recurrence of acute lymphoblastic leukemia who have not received the marrow transplant, in the first complete remission
- Demographic characteristics (age restrictions, gender, socio-economic status, geographical regions): Children ("Patients aged 1-18 years")
Accessible population
Patients from 22 participating Centers for Children and Leukemia (CCLG) in the United Kingdom and Ireland. In November 2006, nine centers in the Australian and New Zealand hematology / oncology group (ANZCHOG) joined the study.
Study sample
Inclusion criteria
Patients with age between 1 to 18 years, on the first relapse of acute lymphoblastic leukemia who did not receive bone marrow transplantation in the first complete remission.
Exclusion criteria
Those with acute B-mature lymphoblastic lymphatic leukemia
Sample size:
Researchers calculated the minimum required sample size for this study based on the following considerations: 80% power to detect a 10% increase (90% vs. 80%) in MRDlo to TP1 between randomized arms using a significance level of 5% for a bilateral test with a 6-7 year employment. Thus they calculated that 219 patients would be needed for each arm of the study.
- The way data is collected
- Depending on the studied population: By sampling (a part of the target population is being studied);
- Depending on the duration of data collection: longitudinal prospective (gather information while following subjects: at baseline and then after a time, to record the advancement of patients);
- Depending on the manner in which group / groups of subjects were formed in the study: ~ Representative sample - several consecutive patients (studying a sample of patients with the same characteristics / inclusion criteria, which copies the true characteristics of the population from which it was extracted. Next, this representative sample was randomized using a masking method, thus leading to the two groups to be compared: the group / the experimental group).
- Definition of studied effect and associated variables
Effects studied:
The studied main effects included:
Progression-free survival was the primary outcome. Progression-free survival was defined as the time from randomization to first failure of induction (5% blast or more in the bone marrow in the first time of assessment, the persistence of blasts CSF, regression increase testicular), recurrence, death from any cause or a second malignancy.
Global survival was a secondary outcome. (defined as the time from randomization to death for any cause.)
The variables studied (only the variables relevant to the proposed scenario are mentioned)
Qualitative variables (attribute): type of treatment, status of censorship.
Survival variables: time to disease progression, survival time.
- Plan of data description and analysis (based on the proposed study scenario, only the methods for describing and analyzing the effects and variables are mentioned)
Data description plan
- For qualitative variables: frequency tables
Data analysis plan
Analysis by tables or figures of the relationship between variables:
- The authors of the study used Kaplan-Meier graphs to show the evolution of the probability of survival over time, depending on the treatment
Statistical analysis according to its objectives:
Evaluation of the therapeutic effect
- Log-rank test - for comparing the survival between the two studied groups
- Quantification of therapeutic efficacy (only if there is a statistically significant therapeutic effect)
- The punctual estimators and confidence intervals (95% CI) of some medical indicators to measure the therapeutic effectiveness:
- Hazard ratio: HR, obtained through Cox regression.
- Probability of survival at 3 years in terms of progression-free survival, respectively global survival
- Median survival time
Analytical tools used: STATA software release 7 (StataCorp, College Station, Texas, USA)
Results obtained in the study. Data analysis and presentation
Following the inclusion and exclusion criteria imposed by the study plan, of the 239 potentially evaluated participants entered consecutively in the study, only 216 were eligible for study and randomized in the two groups studied (see Figure 2 of the article).
Randomized groups have been shown to have comparable characteristics (see Table 2 of the article - similar percentages, median-similar values).
The median follow-up time was 41 months in the two groups (95% CI 34-48).
At three years, the global survival rate was 57.1% (95% CI 49.5-63.9), respectively the progression-free survival rate was 50.3% (95% CI 42.9-57.3 ). The group receiving mitoxantrone had the global survival rate without progression of 69.0% (95% CI 58.5-77.3) (see Figure 1), respectively the progression-free survival rate of 64.6% (95% CI 54, 2-73.2) and the group receiving idarubicin: 45.2% (95% CI 34.5-55.3) and 35.9% (95% CI 25.9-45.9) respectively.
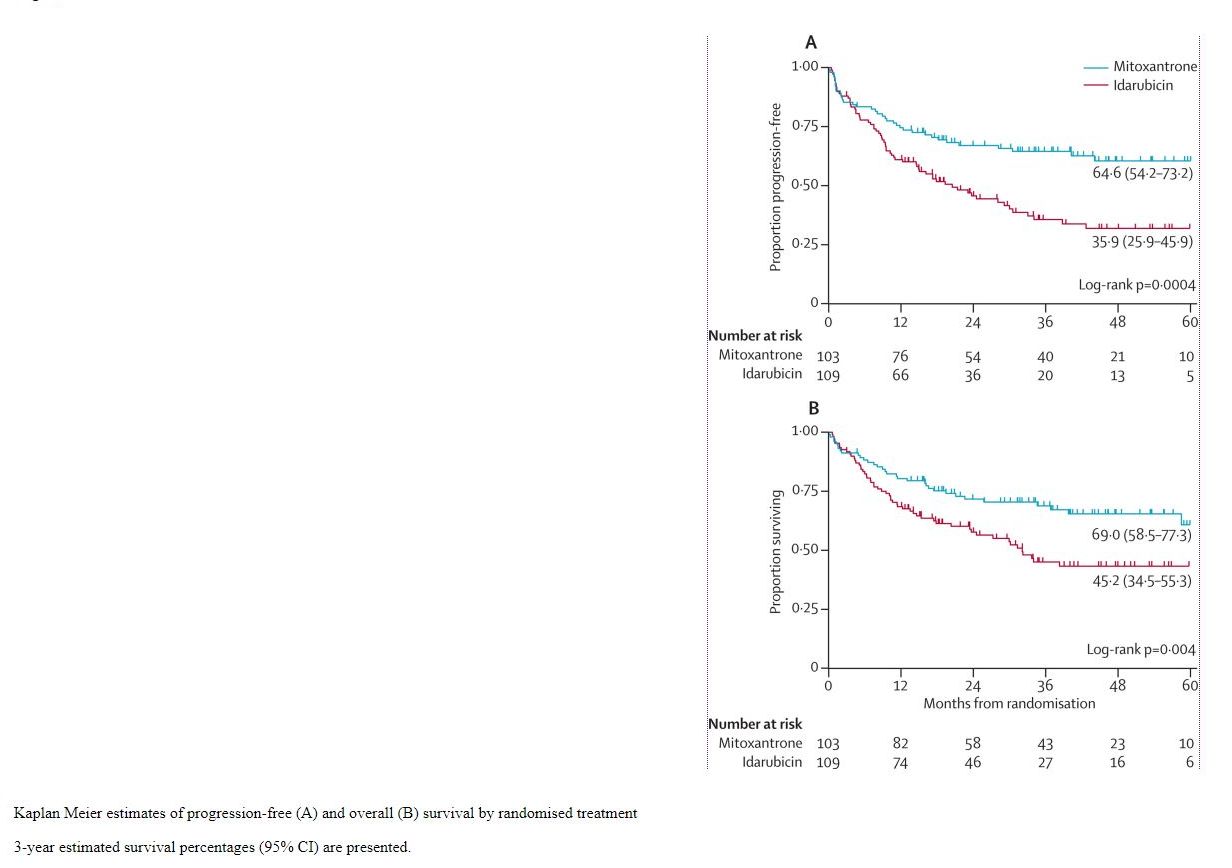
Fig. 1 The evolution of global survival among children with acute lymphoblastic leukemia receiving mitoxantrone (blue) and those receiving idarubicin (red)
The log-rank test comparing the global survival provided a p = 0.0004, comparing the progression-free survival provided a p = 0.004, respectively.
Following the multivariate Cox analysis (adjusting for the effect of other variables of confusion), hazard ratios (mitoxantrone vs. idarubicin) for global survival of 0.56 (95% CI 0.36-0.87), p = 0.01, 0.54 (95% CI 0.36-0.82), p = 0.003.
Interpretation of results. Discussions.
Statistical interpretation
Median follow-up time - 50% of subjects were followed for at least 41 months, or 50% of subjects were followed for less than 41 months.
The proportion of global survival at 3 years for the mitoxantrone group - 69% of subjects who received mitoxantrone at 3 years were still alive.
The difference in global survival rate over 3 years between the mitoxantrone and the idarubicin-treated group - 69% -45.2% = 23.8% - of the subjects who received mitoxantrone at 3 years were still alive by 23, 8% more subjects than those who received idarubicin.
Proportion of 3-year progression-free survival for the mitoxantrone-treated group - 64.6% of subjects who received mitoxantrone at 3 years of disease did not progress.
The log-rank test to compare global survival - there is a statistically significant difference between global survival among those who received mitoxantrone and those who received idarubicin (because p = 0.004 0.05, we reject the null hypothesis and accept the alternative hypothesis.
Null hypothesis: There is no statistically significant difference between global survival between those receiving mitoxantrone and those who received idarubicin.
Alternative hypothesis: there is a statistically significant difference between global survival between those receiving mitoxantrone and those who received idarubicin).
The hazard ratio for overall survival, the point estimator - the hazard of the group receiving mitoxantrone to achieve the predetermined event (death) is 0.56 times higher than the idarubicin group after adjustment for the effect of the other variables. Since 0.56 is less than 1 and because the default event is a negative one (death), the group receiving mitoxantrone is less likely to have a better chance of survival than the idarubicin group. This result is a punctual estimator on the one hand it represents the value of the hazard ratio in the study (on the collected data), but on the other hand it is also the best estimate we have about what is happening in the targeted population (if the sample is representative).
The hazard ratio for global survival, the confidence interval - the true value of the hazard ratio in the target population is between 0.36 and 0.87 with a probability of 95%.
Assessing the precision of hazard ration in terms of global survival - to measure accuracy, we look at the confidence interval width - between 0.36 and 0.87. We can consider the range between 0 and 1 as a range between 0% and 100%. Value 1 means that there are no differences in the hazard of the two groups. Thus, values close to 1 indicate small differences in hazard between groups, and the values greater than 1 indicate large differences. Thus, 0.87 is at a distance of 13% from 1 (100-0.87 = 13), respectively 0.36 is at 64% from 1. We can consider the range between 13% and 64% relatively wide, so the result is relatively imprecise.
Clinical Interpretation
The difference in global survival rate over 3 years between the mitoxantrone and the idarubicin-treated group - 69% - 45.2% = 23.8% - a 23.8% more living subjects is a clinically important outcome – since the purpose is to prevent deaths.
The hazard ratio for overall survival, the 0.56 point estimator suggests a reduction with almost a half of the group receiving mitoxantrone versus the idarubicin-receiving group. We can also look at the result in the form of a difference of 44%, to be compared to the value 1. We can therefore consider that the outcome is clinically significant.
The hazard ratio for global survival, the confidence interval - one end of the confidence interval is 13% vs. 1 and the other 64% vs. 1. 64% is relatively important. For 13%, initially we can think that it is not clinically important, but if we take into account the risk of death, then we can consider that 13% is clinically important. Thus, both ends of the confidence interval are clinically important, we can assume that the entire confidence interval is clinically important.
Conclusion of the study
Mitoxantrone compared to idarubicin in children with acute lymphoblastic leukemia whose disease has recurred under current treatment regimens offers an advantage over global survival and progression-free survival, statistically significant and clinically important.
To remember
Survival data is the time elapsed between starting point of monitoring a subject until the event occurs.
Since the survival data are not normally distributed and the censorship phenomenon is used, the survival time median, Kaplan-Meier graphs are used for describing the data, for comparison was used log-rank test and for prediction - Cox regression with hazard ratio.
The hazard is the imminent risk of a subject to achieve the predetermined event, given that he/she survived until that time, being inversely proportional to survival.